DIY radio observatory progress

February 25, 2026

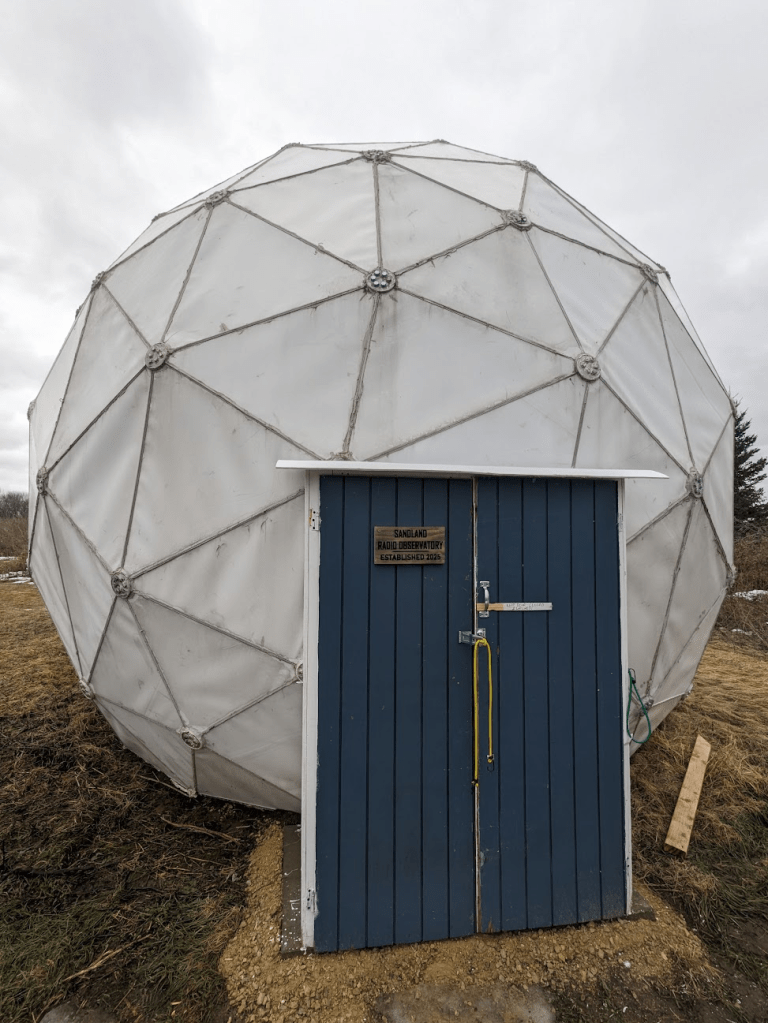
I’ve been making progress on the radio observatory / satellite tracking station at Sandland. We picked this 18ft geodesic radome up a couple years ago from the Carp Observatory and have been slowly getting it put together.

Radome and Arrow II Dual-Band Hamsat antenna.

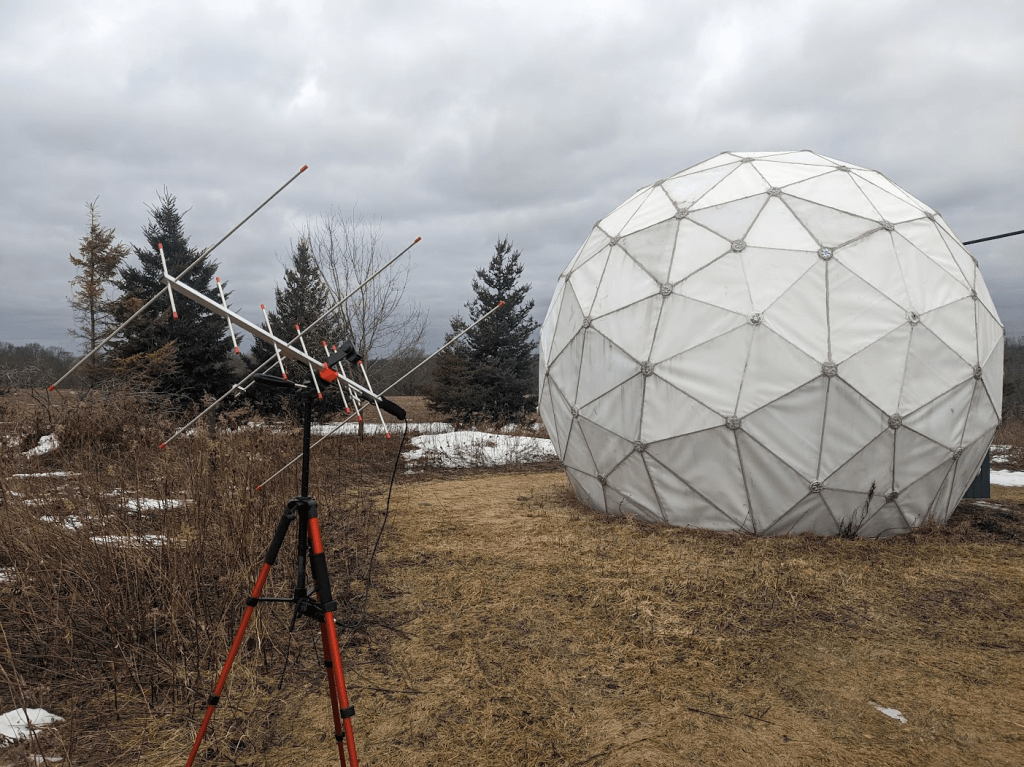
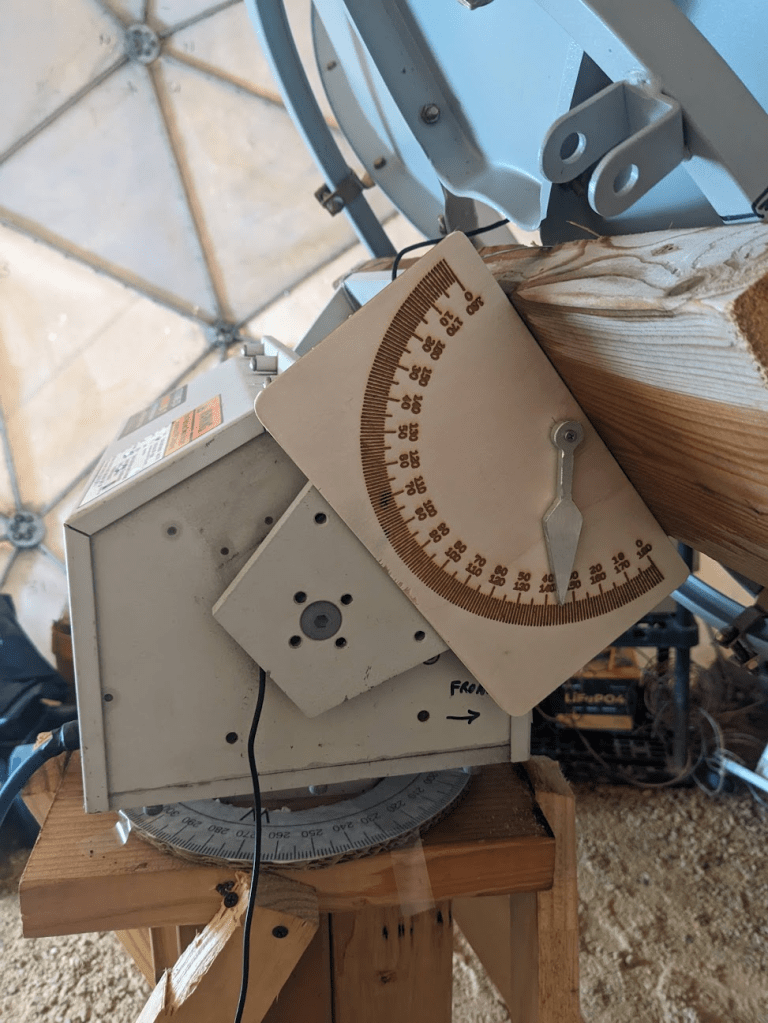
During 2025 I poured a cement footing and installed a satellite dish and motorized pointing system. This is only a 6ft (~1.8M) diameter antenna. The current motor is based on a large pan/tilt mount (Quickset QPT-90) from a vintage security camera. Eventually I hope to install a larger reflector and a more capable motor. I got this dish from Ax-Man Surplus (they don’t often have them and their inventory is constantly changing). I’ve heard these are also sold online as solar cookers.

6ft satellite dish inside the radome.

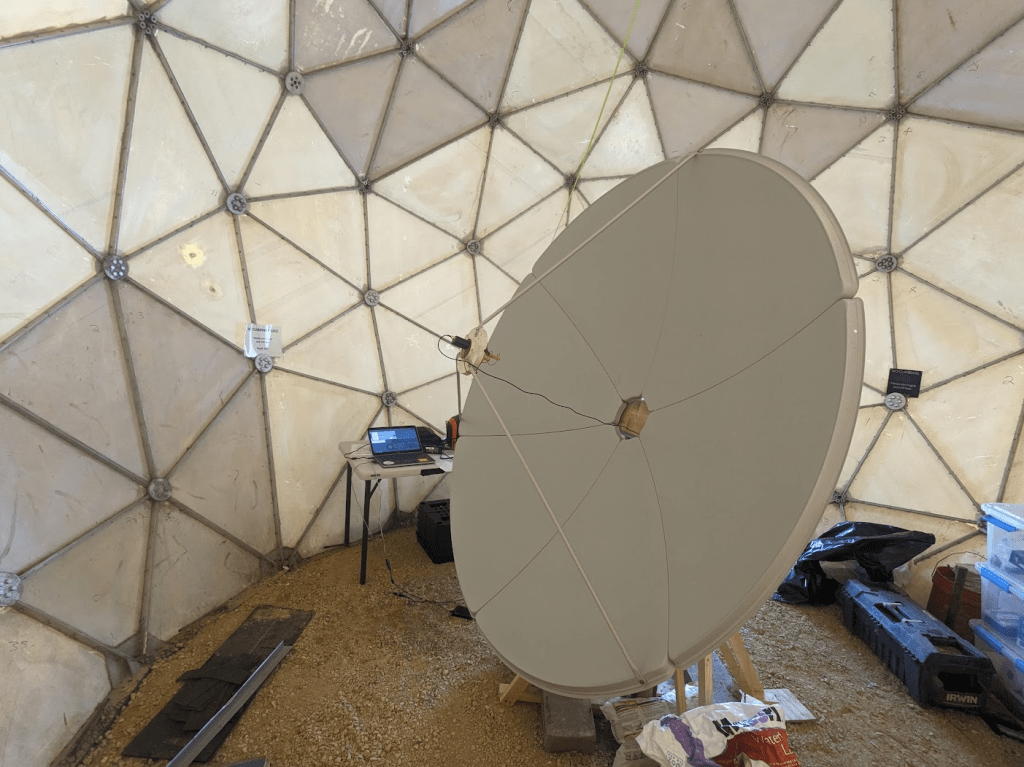
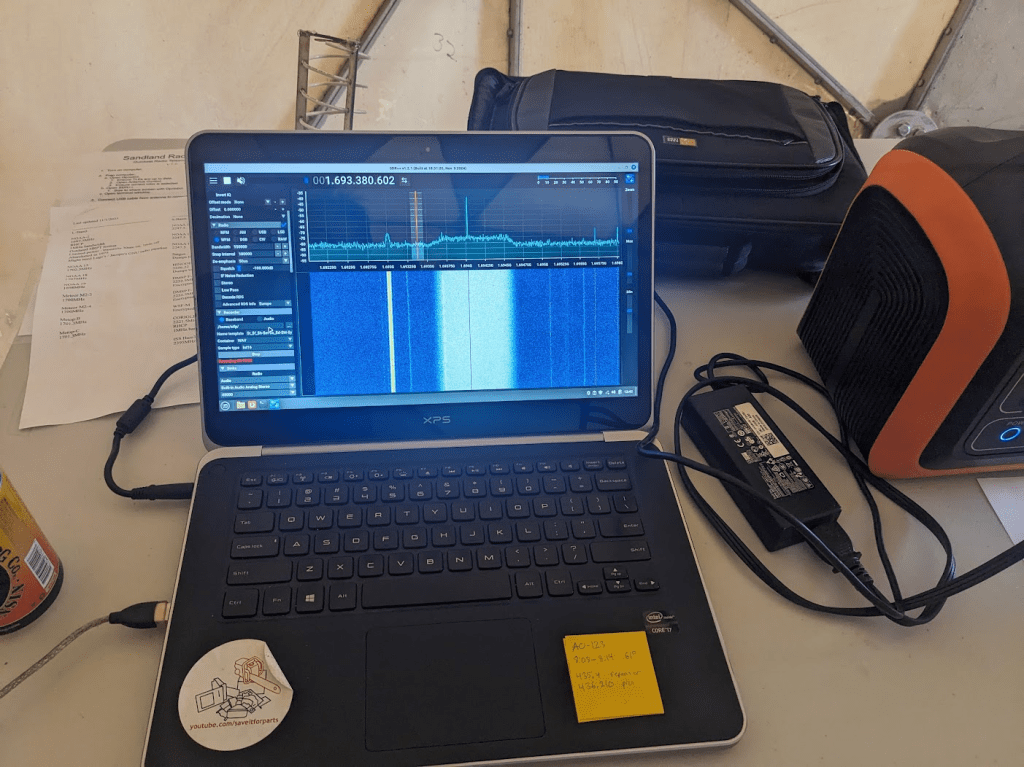
The motor is run by an Arduino microcontroller and surplus 24vAC power supply. Coordinates are passed to the Arduino via serial (USB) connection from a laptop, and the pan/tilt mount uses built-in potentiometers to determine where it’s pointing. I’m using code originally from SARCnet which I’ve modified to work with this setup. The laptop runs Gpredict to calculate positions from orbital data. It also runs SDR++ to record signals from a HackRF One software-defined radio.

Receiving GOES weather satellite with the 6ft dish.

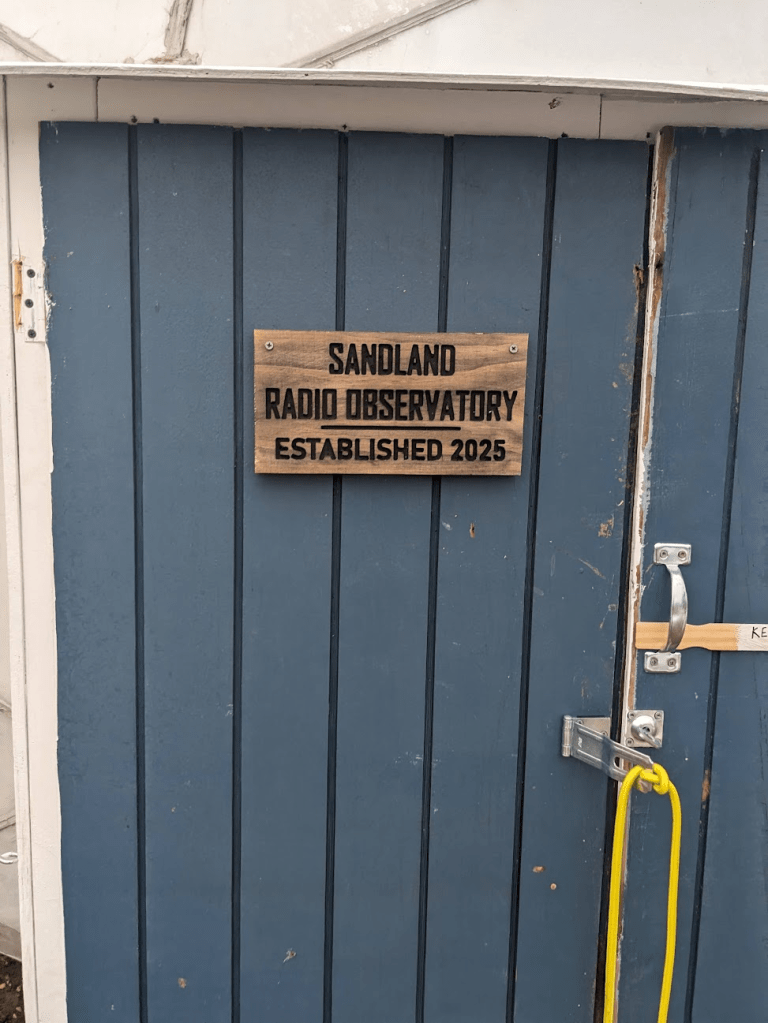
Other projects in 2025 involved finishing the doorway for the dome, so now we can close out wind, rain, and larger wildlife. This took a few tries, people kept leaving the door open for the wind to damage it. The dome is really nice once it’s all closed up, even on a cold February day it’s a nice protected work space! And not having to worry about wind pushing the dish around is nice as well.

New radome door.
CNC door sign for the radome.

I’ve also been calibrating the dish to known geographic coordinates and orientation, so we can get the most accurate pointing. This will be critical when doing astronomy projects, and when tracking fast-moving Low-Earth-Orbit satellites with weak radios.

Manual calibration aid for the dish (I used electronic angle indicators for surveying, but this is handy for quickly seeing where the dish is pointed vs where the computer thinks it’s pointed).

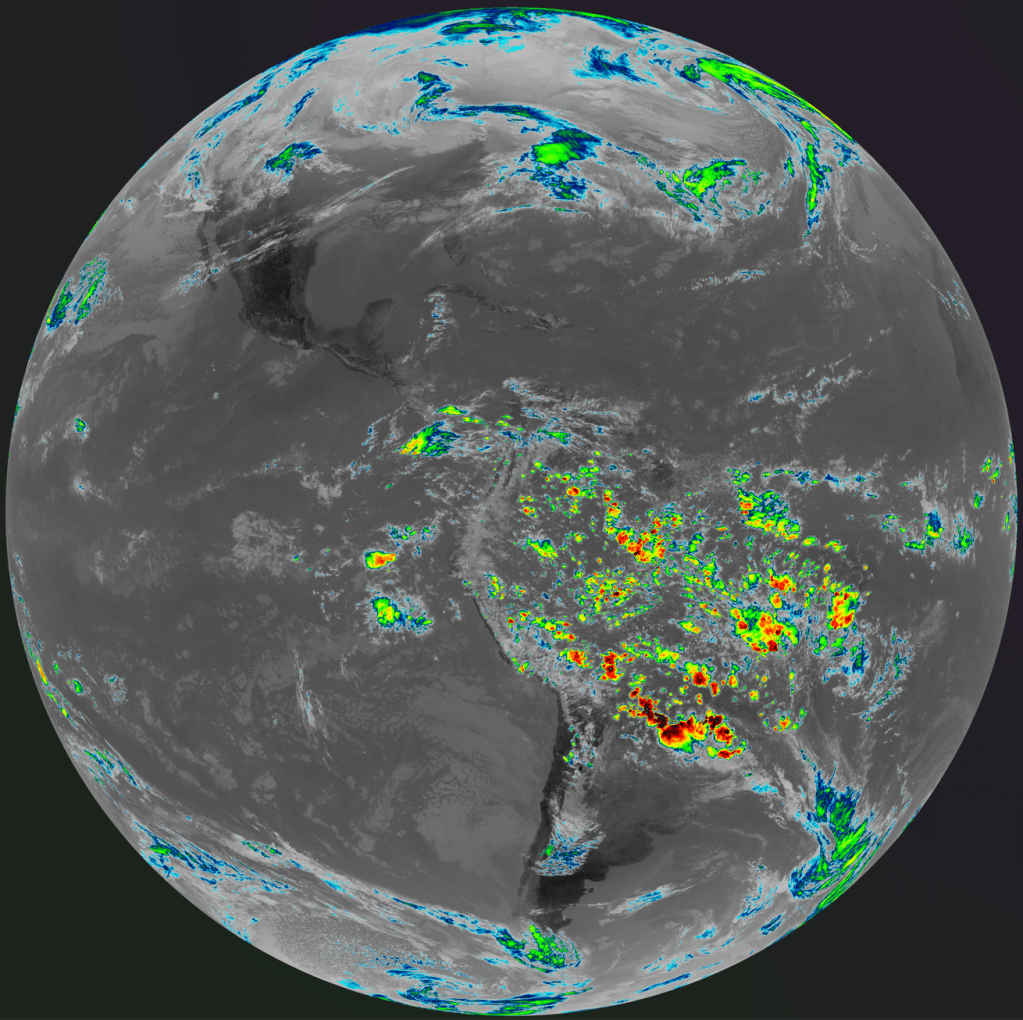
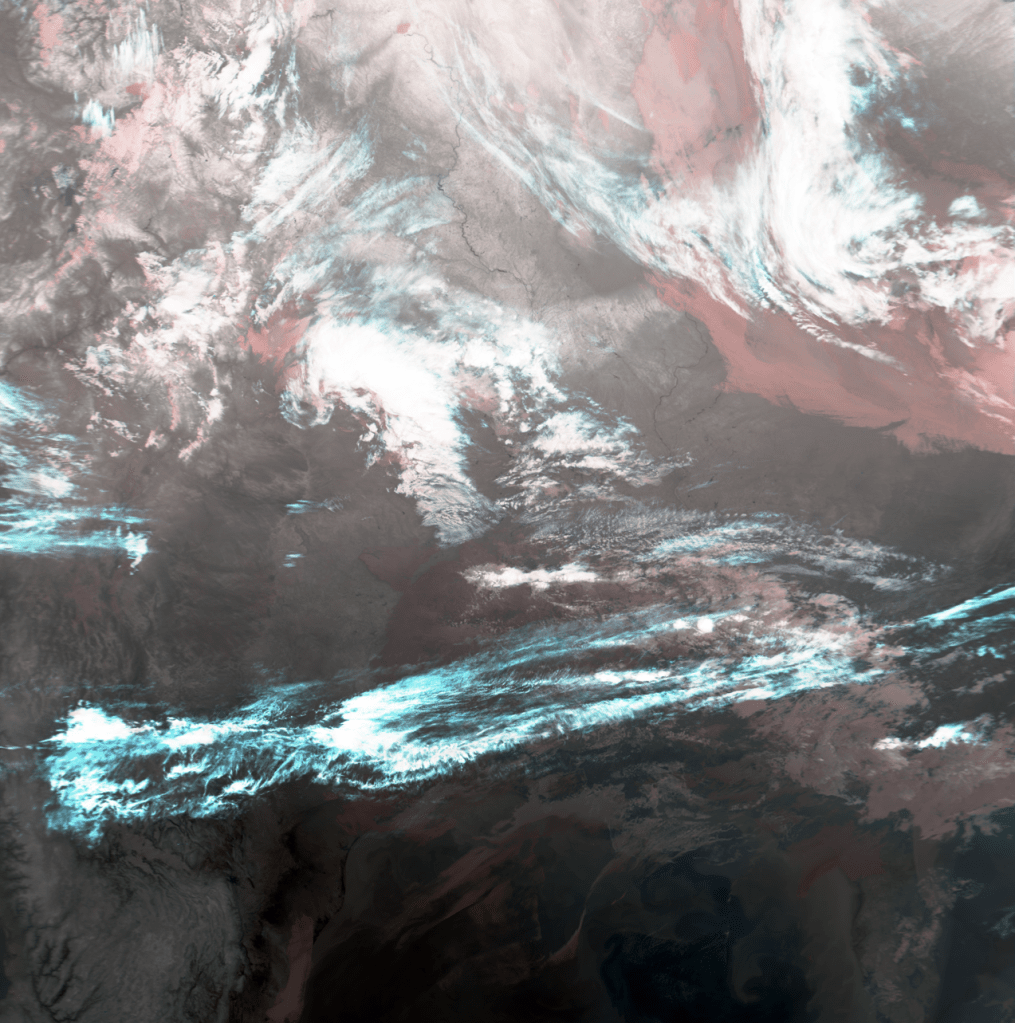
After calibration and some adjustments to my code, the dish has been working great at tracking satellites! It’s so large that I can use almost any feed at the focal point, I’ve been reliably receiving linear L-Band signals with a circular S-Band feed!

GOES-East full disk image with precipitation.
METOP-B weather satellite image.


As usual I have a number of videos about this project on YouTube. You can check some of them out below!


Funter Bay in Maps

May 6, 2013

Here is a compilation of maps and aerial photos showing Funter Bay over more than 100 years. I wish I’d had this collection when I was a kid! They are great for seeing the rise and fall of development around the bay. The difference between high and low tide is also striking. If you’re a boater thinking of visiting Funter, take a look at some of the low-tide images before you take a short-cut, or you may be the next boat that someone has to pull off the sandbar! (Also think of the wind direction and bottom type, the anchors shown as moorage locations on the nautical charts are kind of another local joke… people end up dragging anchor if they use those spots in the wrong winds).

Some of the aerials are very large files, click them if you’d like to view the originals, but give them a few seconds to fully load (they may look grainy or pixelated at first).

I have collected these from several sources. The aerial photos are public domain data, produced by the Department of the Interior / United States Geological Survey. Many of these can be found at http://earthexplorer.usgs.gov/

Most of the topographic maps are products of the USGS, and can be found at http://nationalmap.gov/historical/

Nautical Charts were produced by the US Coast and Geodetic Survey (later NOAA), and some can be found at http://www.nauticalcharts.noaa.gov/csdl/ctp/abstract.htm

Funter Bay in 1905 (Nautical Chart):
1905 chart

1905 vicinity chart:
1905 vicinity chart

1914 nautical chart (essentially the same as the 1905 edition):
1914 chart

1921 USGS map showing some of the mining claims on the South Shore:Funter claims 1921

1948 aerial photo (click to open detailed original scale):
1948 Funter Bay

The 1948 aerial above is cool because it shows many of the old docks and waterfront structures that are now gone. I’ll try to highlight a few of these in a later post.

1951 vicinity map (USGS terrain-shaded topo):
1951 topo

1962 map by the Overseas Mineral Cooperation Association (a Japanese mineral investment group):1962 OMCA Map

I have highlighted structures shown on the OMCA map in red. I find it interesting that they show the cabins near Clear Point as well as the cabin between the creeks at Crab Cove.

1979 CIR aerial, taken from a NASA U-2 Spyplane as part of the Alaska High Altitude Aerial Photo project:
1979 Funter Bay

We did have a framed copy of the image above when I was a kid. This is in Color Infrared or CIR, meaning vegetation is shown in false-color red, and you can discern different types of vegetation from the different shades of red (so clearcuts and patches of different trees stand out from the predominant spruce):

1982 aerial photo (Color Infrared, click to open very large original):
1982 Funter Bay

1985 topo map of Mansfield Peninsula:
1985 topo

1987 nautical chart:
1987 chart

1990s topo map:
Topo

1996 or 1998 aerial photo (current residents may be able to pick out their houses and cabins in this one!):
1998 Funter Bay

2004 satellite image (sorry, not as high-res):
2004 Funter Bay

And just for fun, here are a few of my own photos from various aircraft passing over Funter.

2010 oblique aerial looking South-ish over Crab Cove, coming through the pass from Juneau:
0-aerial-2

2011 oblique of Funter Bay as seen looking NW-ish, from an Alaska Airlines jet:
0-aerial-3

With commercial satellite maps, most companies have yet to include much coverage of Funter Bay. However, if you zoom all the way in on Bing Maps, you’ll get some decently high-resolution imagery (although the light balance is bad).

This site is also really cool: http://alaskafisheries.noaa.gov/shorezone/

Similar to the old California Coastline project (but hopefully with less Barbra Streisand), the Alaska Shorezone Viewer allows you to pull up images (and video) of almost the entire Alaska coast! The interface is a little clunky and takes some getting used to, but the images are amazing!

That’s all I’ve got for now. If I come across any more interesting maps of Funter Bay, I will try to post them here!


You can see my potato cannon from space.

January 25, 2013

One of my larger potato cannons is visible in the latest Google Maps imagery!

space

There it is!

As some back-story, this is out at a friend’s property in rural Wisconsin. We started clearing some camping and bonfire spots last year, and made a “town square” with a flagpole (Rachael made the awesome flag!). The cannon got placed in the town square as a ceremonial reminder of something-or-other (or just to keep it from cluttering up the yard at home).

square

As far as the imagery source goes, it seems to be from late fall of 2012. Based on the info below, I’m about 99% sure it’s satellite imagery, but the resolution is pretty high for the stated capabilities of Google’s imagery suppliers, so it *could* be from aircraft aerial photos. As you zoom in, Google maps displays info about the imagery source on the lower right. At the closest zoom, it just says “Map Data © 2013 Google”. The next level up mentions Geoeye, and as you zoom out it starts mentioning the USDA Farm Service Agency and Digitalglobe. I would tend to assume that the attribution text tells you where all or some of the imagery at a certain zoom level came from, but again, I’m not sure.

Looking into the listed imagery sources, I’ve come up with the following possibilities:
GeoEye contracts with Google to provide imagery from their GeoEye-1 satellite, with 16-inch resolution.
Digitalglobe has several satellites, the newest of which offers an 18-inch resolution.
The USDA Farm Service Agency provides approximately 36-inch resolution, and does not seem to have data from 2012 yet.

I’m guessing the Google Earth image above came from the GeoEye-1 sat. If so, it can obviously discern features slightly smaller than 16 inches, since the potato cannon is only about 3″ wide. You can even faintly make out the wider chamber (6″ IIRC) on the left side.

The smaller blue blob is also my doing, it’s a woodshed with a blue tarp roof (I meant to roof it with tarpaper shingles but got lazy, and another friend was already roofing his nearby shed with tarps, so we went the redneck option all around).

woodshed

So, I now have the questionable distinction of creating things that are visible from orbit! I suppose it’s only fitting that those things are total hillbilly creations 😛 Once Google updates the data over my new house and shows my roof repairs, I’m sure I’ll have more to look on with (actual) pride, but for now this will have to do!